Introduction: Where You Are Matters as Much as What You Do
Most small business security conversations start with the wrong question. Business owners ask what alarm system to buy or whether to install cameras. The better question, the one that determines how much risk a business is actually carrying before any security decision is made, is where the business is located, and what time of year it is.
The data that drives this report proves why those two variables matter so much. Memphis had the highest burglary rate among the large metropolitan areas examined, at 412 reported burglaries per 100,000 residents. Tulsa ranked second at 367.2, followed by Seattle-Tacoma-Bellevue at 362.4, Oklahoma City at 348.3, and Las Vegas at 344.6. A small business operating in Memphis faces a fundamentally different threat environment from one operating in the same industry in New Hampshire, where the statewide burglary rate is among the lowest in the country.
The assumption that summer is universally “burglary season” is challenged by new city-level data, which found that burglary patterns vary significantly across the United States. While burglary rises modestly during the summer nationwide, the pattern varies dramatically depending on where you live. In many parts of the country, summer really is burglary season. Along much of the West Coast, however, the opposite is true.
This report maps the commercial property crime landscape across North America at the city and seasonal level, giving small business owners, property managers, security consultants, and insurers the geographic and temporal intelligence needed to make security investment decisions that are calibrated to actual local risk rather than national averages.
Key Findings at a Glance
- Memphis, Tennessee, recorded 5,616 burglaries in 2024 and 6,899 property crimes per 100,000 people, the highest property crime rate of any major U.S. city and more than a thousand incidents per 100,000 above any other city.
- Summer burglary rates are approximately 11% higher than winter nationally but this national average conceals dramatic city-level variation that makes it nearly useless as a planning tool for individual business owners.
- Minneapolis has the highest summer burglary spike nationally, with burglaries rising 47% from June through August compared to the rest of the year.
- Cold-winter cities average an 11.9% summer burglary lift more than double the national aggregate increase. Sun Belt cities show only a 4.8% summer lift. Pacific Coast cities average a slight decline in burglary during summer.
- Winnipeg ranks first in Canada for break-in composite score and break-in rate, making it the country’s break-in capital, according to the Sher Property Crime Index 2024.
- In 2024, burglars got away with an average of $6,000 in loot per incident, about five times more than victims lost in 2000.
- Police cleared only 11% of burglary cases in 2024 meaning 89 out of every 100 commercial break-ins resulted in no arrest.
- Toronto recorded 6,092 break-ins in 2025, with the University neighbourhood posting a break-in rate nearly four times the city average.
Part I – The U.S. Commercial Property Crime Map
National Baseline
There were 779,542 burglary incidents reported in 2024, a decline of about 8.1% from 841,942 in 2023. The national burglary rate fell to 229.2 per 100,000 people in 2024, the lowest rate in the FBI’s records going back to at least 1961.
That headline number is genuinely good news. But it is also potentially dangerous for small business owners who use it to calibrate their own risk. National averages compress enormous geographic variance into a single figure that accurately describes no specific city. New Mexico’s burglary rate is more than 10 times New Hampshire’s, the difference between the highest and lowest state is wider than for almost any other property crime category.
High-Risk U.S. Metro Areas: The Commercial Crime Tier
The following table presents the highest-risk major U.S. metropolitan areas for commercial burglary and property crime based on FBI Crime in the United States 2024 data and metropolitan-area analysis from SafeWise, MoneyGeek, and The Hill.
| Rank | City | Burglary Rate (per 100,000) | Total Burglaries (2024) | Peak Season | Risk Tier |
| 1 | Memphis, TN | 412 (metro) / 6,899 property crime | 5,616 | Summer | 🔴 Extreme |
| 2 | Tulsa, OK | 367.2 | Not separately reported | Summer | 🔴 Extreme |
| 3 | Seattle-Tacoma-Bellevue, WA | 362.4 | 4,532 (Portland comparable) | Winter | 🔴 Extreme |
| 4 | Oklahoma City, OK | 348.3 | Not separately reported | Summer | 🔴 Extreme |
| 5 | Las Vegas, NV | 344.6 | Not separately reported | Summer | 🔴 High |
| 6 | Portland, OR | 5,526 property crime per 100K | 4,532 | Winter | 🔴 High |
| 7 | Houston, TX | 4,293 property crime per 100K | 14,953 | Summer | 🔴 High |
| 8 | Kansas City, MO | 4,676 property crime per 100K | 2,508 | Summer | 🟠 High |
| 9 | Philadelphia, PA | 4,548 property crime per 100K | ~5,000 | Summer | 🟠 High |
| 10 | Springfield, IL (metro) | 1,035.6 burglary rate | Highest U.S. metro | Summer | 🟠 High |
Sources: FBI Crime in the United States 2024 (released Summer 2025); SafeWise Most Burglarized City Analysis 2024; The Hill property crime rankings; MoneyGeek metro area analysis. Property crime rates and burglary rates use different denominators and methodologies see Methodology section.
Lower-Risk U.S. Metro Areas: The Safe Zone Cities
The concentration of low-burglary metropolitan areas in New Hampshire, Pennsylvania, and Wisconsin suggests that regional factors, including strong local economies, high homeownership rates, and robust community safety programs, contribute to burglary prevention success.
| City / State | Relative Risk | Notes |
| New Hampshire (statewide) | 🟢 Lowest in nation | 48.7 per 100,000 — lowest state burglary rate (FBI 2024) |
| Pittsburgh, PA metro | 🟢 Very Low | Consistently ranks as lowest-risk major metro (FEMA NRI) |
| Columbus, OH | 🟢 Low | Top 10 safest major city — 82–91% of properties in lowest risk tier |
| Madison, WI | 🟢 Low | Mid-range summer lift; low baseline rate |
| Vermont (statewide) | 🟢 Very Low | Among lowest property crime states nationally |
For a small business owner choosing between two otherwise equivalent locations in different cities, the gap between a Memphis-level risk environment and a Pittsburgh-level risk environment is not a marginal consideration. It is a difference in expected annual security cost, expected break-in probability, and expected insurance premium that compounds year over year.
Part II – The Seasonal Heat Map: When Break-Ins Peak by City Type
The seasonal dimension of commercial burglary risk is the finding in this report that most surprises business owners and most directly changes what practical security decisions look like at different times of year.
The National Seasonal Pattern – And Why It Misleads
Over half 53% of burglaries occur in the afternoon, with the most popular hours being 12 p.m. to 1 p.m. and 5 p.m. to 6 p.m. As temperatures increase during the summer, burglary cases increase by 11% compared to the winter.
That 11% national summer increase is the figure most widely cited in security literature. It is accurate at the aggregate level and nearly useless at the city level, because the city-level data shows a pattern so varied that the national figure applies precisely to almost no city in the country.
After examining burglary reports from 74 of the nation’s largest cities between 2022 and 2024, researchers found that while burglary rises modestly during the summer nationwide, the pattern varies dramatically depending on where you live.
The Three Distinct Seasonal Patterns
MoneyGeek’s analysis of FBI NIBRS burglary data from 2022 through 2024, covering 74 of the largest U.S. cities, identifies three fundamentally different seasonal crime patterns and the city type a business is located in determines which pattern applies.
Pattern 1: Cold-Winter Cities – Classic Summer Spike
The 35 cold-winter cities average an 11.9% summer lift. This is the classic pattern: a deep winter trough and a summer peak exactly the shape the warnings describe.
Minneapolis has the highest summer burglary spike nationally, with burglaries rising 47% from June through August compared to the rest of the year. The effect is not subtle. For a Minneapolis small business, June through August represents a categorically different risk environment than December through February.
The mechanism is well-understood: school summer vacations expand the pool of potential offenders with unstructured time. Longer daylight hours extend the window of opportunity for daytime break-ins. Vacation travel leaves commercial and retail properties with less regular foot traffic around them. And heat itself appears to correlate with crime frequency crime increases exponentially as the heat index nears 100 degrees.
Cities following this pattern and their summer lift:
| City | Summer Lift % | Peak Month | City Type |
| Minneapolis, MN | +47% | July | Cold-Winter |
| Madison, WI | Significant lift | July | Cold-Winter |
| Louisville, KY | Notable lift | July-August | Cold-Winter |
| Omaha, NE | Notable lift | July | Cold-Winter |
| Jersey City, NJ | Notable lift | July-August | Cold-Winter |
| Buffalo, NY | Moderate lift | July (summer avg. highest) | Cold-Winter |
| National average | +11% | July-August | Aggregate |
Source: MoneyGeek analysis of FBI NIBRS data, 2022–2024 (published 2026). Summer Lift % = percent difference between city’s average summer monthly burglary count (June–August) and average non-summer monthly count.
Pattern 2: Sun Belt Cities – Weak Seasonal Signal
Sun Belt cities show a weaker seasonal pattern, averaging a 4.8% summer lift. Year-round outdoor activity means commercial properties are rarely left in the seasonal lull that a Minnesota winter creates.
For Sun Belt business owners in cities like Dallas, Houston, Phoenix, and Atlanta, the practical implication is that there is no single “high season” and “low season” for security vigilance. Burglary risk is distributed more evenly across the calendar year, which means security investments and protocols need to be maintained consistently rather than ramped up in summer and relaxed in winter.
Pattern 3: Pacific Coast Cities – Winter Seasonality
Several coastal cities appear to have a winter burglary season instead, with Riverside peaking in February, while Portland, San Diego, and Honolulu peak in January.
Fourteen of the 15 most seasonal cities in the country are cold-winter cities. Ten of the 14 Pacific Coast cities post a negative summer lift: burglary runs lower in summer than the rest of the year.
Riverside showed the strongest reversal, with burglary rates falling more than 12% during the summer months. Honolulu and several other coastal cities displayed similar trends.
For a Pacific Coast business owner, conventional wisdom about summer security is not just inapplicable,it is inverted. A Portland or San Diego business that intensifies security protocols in summer and relaxes them in winter has the seasonal risk calendar exactly backwards.
The Seasonal Crime Calendar: A City-Type Reference
| Season | Cold-Winter Cities | Sun Belt Cities | Pacific Coast Cities |
| January–February | 🟢 Lowest risk period | 🟡 Moderate | 🔴 Peak risk period |
| March–May | 🟡 Rising risk | 🟡 Moderate | 🟡 Elevated — declining |
| June–August | 🔴 Peak risk period | 🟠 Slightly elevated | 🟢 Lowest risk period |
| September–November | 🟠 Declining | 🟡 Moderate | 🟡 Rising risk |
| December | 🟢 Low (with holiday travel spike caveat) | 🟡 Moderate | 🟠 Elevated |
Based on MoneyGeek analysis of FBI NIBRS data from 2022–2024 (published 2026). Cold-Winter cities include Minneapolis, Chicago, Detroit, Boston, Buffalo, Milwaukee, Cleveland, Pittsburgh, Indianapolis, and comparable metros. Sun Belt cities include Dallas, Houston, Atlanta, Phoenix, Miami, and comparable metros. Pacific Coast cities include Seattle, Portland, Los Angeles, San Diego, San Francisco, Sacramento, Riverside, and Honolulu.
Part III – The Canadian Commercial Crime Map
The Canadian property crime picture operates on different data infrastructure than the U.S. Statistics Canada’s Crime Severity Index and police-reported crime data are the primary sources but the geographic and seasonal patterns that emerge are equally important for Canadian small business owners.
The Canadian National Picture
The volume and severity of police-reported crime in Canada, as measured by the Crime Severity Index (CSI), decreased 4% in 2024, following three consecutive years of increases.
The rate of breaking and entering, the most severe type of property crime based on its weight in the CSI, declined 11% from the previous year to 293 incidents per 100,000 population in 2024. Overall, there were 121,033 incidents of breaking and entering in 2024, which accounted for 13% of the overall CSI, the most of any violation.
Those headline declines are meaningful, but, as in the United States, they conceal geographic concentration that makes them nearly irrelevant to a business owner in Winnipeg or Chilliwack.
High-Risk Canadian Cities: The Commercial Break-In Tier
| Rank | City | Break-In Rate (per 100,000) | Key Data Point | Risk Tier |
| 1 | Winnipeg, MB | 5,862 | Ranked #1 for break-in composite and rate nationally (Sher Index 2024) | 🔴 Extreme |
| 2 | Chilliwack, BC | 508 | 104% above the national rate (Maclean’s analysis) | 🔴 Extreme |
| 3 | Kamloops, BC | 683 | Among highest per-capita break-in rates in BC | 🔴 High |
| 4 | Lethbridge, AB | 760 | Consistent top-5 in Alberta for B&E rate | 🔴 High |
| 5 | Prince George, BC | Not separately listed | 66.6% above national rate (Maclean’s) | 🔴 High |
| 6 | Surrey, BC | Not separately listed | 50.1% above national rate (Maclean’s) | 🟠 High |
| 7 | Regina, SK | Not separately listed | 44.8% above national rate (Maclean’s) | 🟠 High |
| 8 | Edmonton, AB | 1,965 | 30.8% above national rate | 🟠 High |
| 9 | Montreal, QC | Not separately listed | 39.8% above national rate (Maclean’s) | 🟠 Moderate-High |
| 10 | Vancouver, BC | Not separately listed | 36.9% above national rate (Maclean’s) | 🟠 Moderate-High |
Sources: Credit Card Genius “Most Dangerous Cities in Canada,” using Statistics Canada 2024 data; Sher Property Crime Index 2024 (sig.ca); Maclean’s Canada’s Most Dangerous Cities Breaking and Entering analysis. All rates per 100,000 unless otherwise noted.
Toronto: Volume vs. Rate
Toronto recorded 6,092 break-ins in 2025, with the University neighbourhood posting a break-in rate nearly four times the city average, the highest of any Toronto neighbourhood. The Annex ranked seventh by rate but first in the entire city for total break-ins, with 149 reported incidents.
Toronto ranks first overall on the Sher Property Crime Index 2024, with the highest composite property crime score, driven by record auto theft totals. For sheer incident volume, Toronto is Canada’s break-in capital. For rate-per-capita severity, Winnipeg holds that designation.
Brampton’s break-ins rose 20% in 2025 while Mississauga’s fell 15% in the same year, a divergence that illustrates how dramatically risk can shift between adjacent cities, and why city-level rather than regional data is the appropriate planning unit for small businesses.
Lower-Risk Canadian Cities
| City | Risk Level | Notes |
| Sherbrooke, QC | 🟢 Lowest nationally | Ranked safest in Canada on Sher Property Crime Index 2024 |
| Barrie, ON | 🟢 Very Low | Lowest metropolitan Crime Severity Index score nationally |
| Quebec City, QC | 🟢 Low | Consistently below national average across property crime categories |
| Ottawa, ON | 🟢 Low | Below national average; federal presence contributes to lower crime density |
| Halifax, NS | 🟡 Moderate | Below Prairie and BC rates; rising concern from CFIB survey data |
Sources: Sher Property Crime Index 2024; Statistics Canada Crime Severity Index CMA data 2024; viewhomes.ca Home Security Statistics Canada 2026.
Part IV – Industry Spotlight: Which Business Types Are Highest-Risk by City
Commercial break-in risk is not evenly distributed across business types in any given city. The combination of city risk tier and business type determines the actual exposure any individual business carries.
The Industry-by-City Risk Matrix
| Business Type | High-Risk City Match | Seasonal Peak | Primary Vulnerability |
| Restaurants | Memphis, Houston, Portland | Summer (cold-winter cities); Year-round (Sun Belt) | Cash handling, predictable hours, after-hours vacancy |
| Retail / Convenience | Tulsa, Oklahoma City, Winnipeg | Summer | Accessible storefronts, visible inventory, late hours |
| Construction / Trade | All high-risk cities; rural areas | Summer | Unattended equipment, job site access, tool resale value |
| Healthcare / Pharmacy | Urban high-density (Philadelphia, Kansas City) | Year-round | Pharmaceutical theft; medical equipment resale |
| Electronics / Tech Retail | Any high-crime metro | Summer | High resale value; organized crime targeting |
| Automotive / Parts | Las Vegas, Memphis, Tulsa | Year-round | Parts resale channels; outdoor exposure |
| Food & Beverage (Liquor) | Portland, Seattle, Vancouver | Winter (Pacific Coast); Summer (Cold-Winter) | After-hours; high-value inventory |
The Commercial Storefront Problem
In 2023, 42,508 commercial properties or office buildings were burglarized, per Statista. Small businesses such as restaurants (23,358 burglaries), convenience stores (12,397 burglaries), gas stations (6,335 burglaries), and grocery stores (5,459 burglaries) are particularly targeted.
The common thread across every high-frequency commercial burglary category is the unprotected storefront. When a business closes for the night, the transition from occupied to unoccupied creates a vulnerability window that is determined almost entirely by the quality of the physical barrier between the interior of the business and the street. Glass storefronts with standard locks represent the lowest resistance point in a commercial building’s security profile, and the data on which businesses get hit most frequently reflects exactly that vulnerability.
Part V – The Time-of-Day Dimension
Seasonal risk and city risk are two dimensions of the commercial break-in threat. The third dimension — time of day, is where security decisions about physical barriers, alarm monitoring, and after-hours access control become most directly actionable.
When Commercial Break-Ins Happen
Over half 53% of burglaries occur in the afternoon, with the most popular hours being 12 p.m. to 1 p.m. and 5 p.m. to 6 p.m.
The afternoon peak contradicts the most common assumption about commercial burglary, that it happens in the middle of the night, while businesses are clearly closed and the streets are empty. The reality is more nuanced. Many commercial break-ins occur during the lunch hour, when business activity in a district drops temporarily and foot traffic is reduced, or in the early evening transition period between business hours and night, when staff are leaving but the business has not yet fully secured.
The After-Hours Window: Where Physical Barriers Matter Most
The overnight window, roughly 10 p.m. to 6 a.m. is not the period of highest frequency, but it is the period of highest vulnerability per incident. Overnight break-ins have longer dwell times, higher average theft values, and lower probability of interruption than daytime break-ins. For commercial premises that carry high-value inventory or cash, the overnight window is where the most costly incidents concentrate.
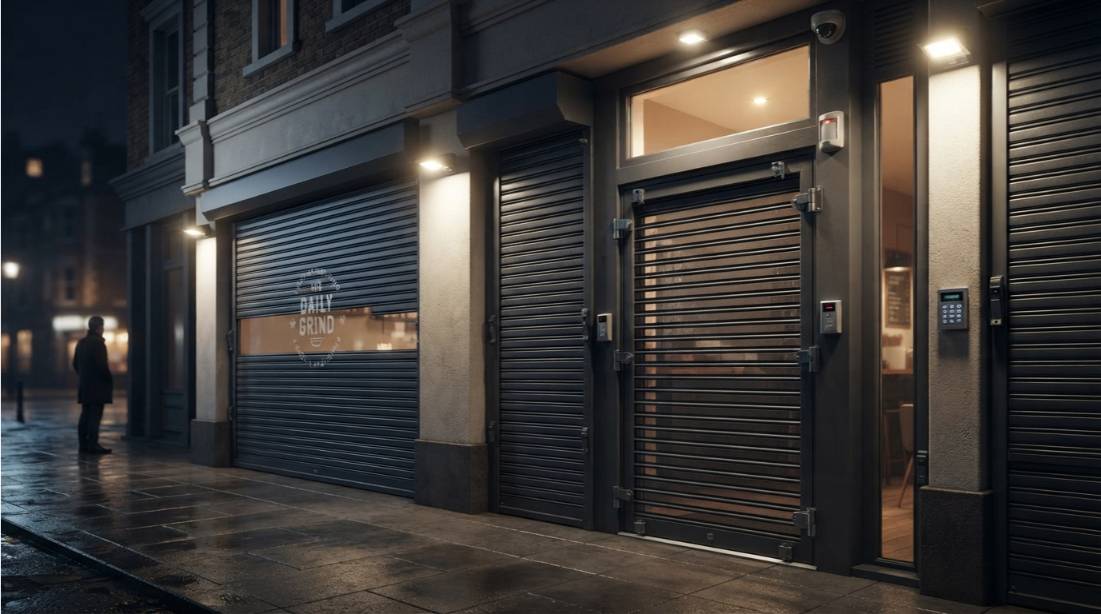
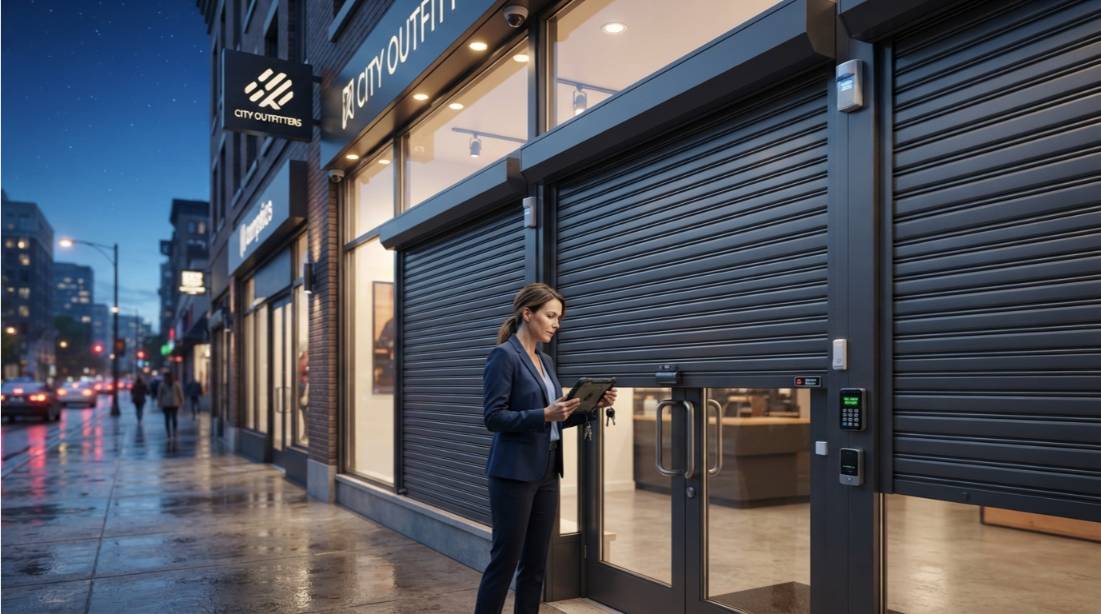
This is precisely the vulnerability window that physical barriers, roll shutters, security grilles, reinforced door systems address most directly. A business that closes with a visible physical barrier deployed across its storefront eliminates the overnight window entirely for opportunistic entry. The barrier communicates a resistance level that redirects criminal attention before an attempt is made.
Time-of-Day Risk Reference for Commercial Business Owners:
| Time Window | Risk Level | Primary Threat Type | Physical Security Role |
| 6 AM – 12 PM | 🟡 Moderate | Early opening vulnerability; low foot traffic | Alarm monitoring; access control |
| 12 PM – 1 PM | 🔴 Peak | Lunch hour opportunistic theft | Staff awareness; visible deterrence |
| 5 PM – 6 PM | 🔴 Peak | Transition period — staff departing | Shutter deployment; alarm activation |
| 6 PM – 10 PM | 🟠 Elevated | After-hours — business closed, nearby activity | Physical barrier; monitored alarm |
| 10 PM – 6 AM | 🟠 Elevated (high value) | Extended dwell; high-value targeting | Physical barrier; perimeter lighting |
| Weekends / holidays | 🔴 Elevated | Extended unoccupied periods | Full perimeter protection |
Part VI The Recovery Reality: Why Prevention Beats Response
Understanding where and when commercial break-ins occur leads to the most actionable conclusion in this report: the recovery outlook after a commercial break-in is poor enough that prevention is not just preferable to response, it is the only financially rational strategy.
The police have solved only 11% of burglary cases, whereas victimization reported reached 41.5%. That 11% clearance rate means that for every nine commercial break-ins that occur, the offender faces no consequence whatsoever. There is no law enforcement deterrence mechanism functioning in 89% of commercial burglary cases.
In 2024, burglars got away with an average of $6,000 in loot per incident, about five times more than victims lost in 2000. The per-incident loss is rising faster than inflation because the merchandise categories most frequently targeted electronics, tools, pharmaceuticals, and organized retail crime targets have appreciated in value while becoming more portable and more easily resold through online marketplaces.
Filing a theft claim can lead to increased insurance premiums or, in some cases, the risk of nonrenewal. The incident itself generates the immediate loss. The insurance response generates the long-term cost. A small business that files multiple theft claims risks policy nonrenewal, forcing it into the surplus lines market at significantly higher rates, a compounding financial consequence that extends years beyond the original incident.
The deterrence evidence is clear. A property with security cameras is 300% less likely to experience a break-in than one without. And the criminology literature consistently places visible physical barriers, roll shutters, security grilles, reinforced door systems,at the highest tier of commercial burglary deterrence. Physical barriers work because they change the offender’s calculation before any entry is attempted: a business that presents a visible, credible physical barrier redirects criminal attention to less-protected alternatives on the same block.
Part VII, City-Specific Security Timing Guide
Based on the seasonal patterns documented in this report, the following calendar provides city-specific guidance on when to intensify security protocols and when standard protocols are adequate.
Cold-Winter U.S. Cities (Minneapolis, Chicago, Detroit, Boston, Indianapolis, Cleveland, Pittsburgh, Buffalo, Milwaukee)
| Month | Action |
| January–March | Standard protocol – lowest seasonal risk period; use for security system maintenance and inspection |
| April–May | Begin seasonal readiness – inspect shutters, test alarms, review after-hours protocols |
| June–August | Maximum vigilance – peak seasonal risk. Ensure all physical barriers are fully operational. Consider extended monitoring hours. |
| September–October | Elevated – declining but above annual average |
| November–December | Standard protocol – holiday travel creates localized spikes; ensure full barrier deployment during closures |
Sun Belt U.S. Cities (Dallas, Houston, Atlanta, Phoenix, Miami, San Antonio, Nashville)
| Month | Risk Level | Action |
| All months | 🟡 Consistently moderate | Maintain year-round consistent security protocol — no single peak season justifies relaxing vigilance at other times |
| August–September | 🟠 Slightly elevated | Minor summer lift; marginally increase awareness during late afternoon transition hours |
| Holidays / long weekends | 🔴 Elevated | Extended closure periods require full physical barrier deployment and alarm monitoring confirmation |
Pacific Coast Cities (Seattle, Portland, Los Angeles, San Diego, San Francisco, Riverside, Honolulu)
| Month | Action |
| January–February | Maximum vigilance – peak seasonal risk. Ensure all physical barriers are fully operational. |
| March–May | Elevated – declining; maintain heightened awareness |
| June–August | Standard protocol – lowest seasonal risk; good period for system maintenance |
| September–December | Rising risk – increase monitoring and ensure physical barriers are fully operational entering winter |
Canadian Prairie Cities (Winnipeg, Saskatoon, Regina, Edmonton, Lethbridge)
| Month | Action |
| January–February | Lower risk period — extreme cold reduces opportunistic crime |
| May–September | Peak risk – summer pattern mirrors U.S. cold-winter cities; 10–15% elevated risk vs. winter |
| October | Transition – begin increased monitoring as summer pattern fades |
| November–December | Holiday period – extended closures require full physical barrier deployment |
Seasonal guidance is based on MoneyGeek analysis of FBI NIBRS data (2022–2024, published 2026). Canadian seasonal estimates are inferred from the cold-winter city pattern. Individual city data may vary.
Part VIII – What the Heat Map Means for Security Investment Decisions
The city-and-season data in this report has direct implications for how small business owners should prioritize and sequence their security investment. The following framework translates the geographic and temporal risk picture into actionable investment logic.
Tier 1 – Businesses in Extreme Risk Cities (Memphis, Tulsa, Oklahoma City, Las Vegas, Portland, Winnipeg, Chilliwack):
Physical perimeter protection is the non-negotiable baseline investment. At these risk levels, relying on alarm systems and cameras alone means accepting a high probability of a break-in within any five-year period. Roll shutters or equivalent exterior barriers on all street-facing storefronts, monitored alarm systems with sub-five-minute response times, and perimeter lighting are all justified by the baseline risk environment regardless of business type or season.
Tier 2 – Businesses in High-Risk Cities During Peak Season (Cold-Winter cities in June–August; Pacific Coast cities in January–February):
Seasonal intensification of security protocols is warranted. Businesses that maintain adequate off-season security can add a seasonal layer, extended monitoring hours, physical barrier deployment every night rather than only selected nights, and additional staff awareness training, during the documented peak period for their city type.
Tier 3 – Businesses in Moderate-Risk Cities with High-Value Inventory:
Business type can elevate risk above what city-level data suggests. A jewelry retailer or electronics store in a moderate-risk city like Ottawa or Columbus is a more attractive target than the aggregate city data implies. High-value merchandise categories justify physical security investment that exceeds what the city baseline risk would recommend.
For All Tiers – The After-Hours Rule:
Regardless of city risk tier or season, the after-hours transition period, specifically the window between staff departure and full overnight security activation is the highest-vulnerability moment in any commercial business day. The most popular burglary hours are 12 p.m. to 1 p.m. and 5 p.m. to 6 p.m. The 5–6 p.m. window means that a business whose physical security is not deployed until an hour after closing is leaving its most vulnerable daily window unprotected. Roll shutters and physical barriers deployed at close of business rather than at an arbitrary later time eliminate this vulnerability completely.