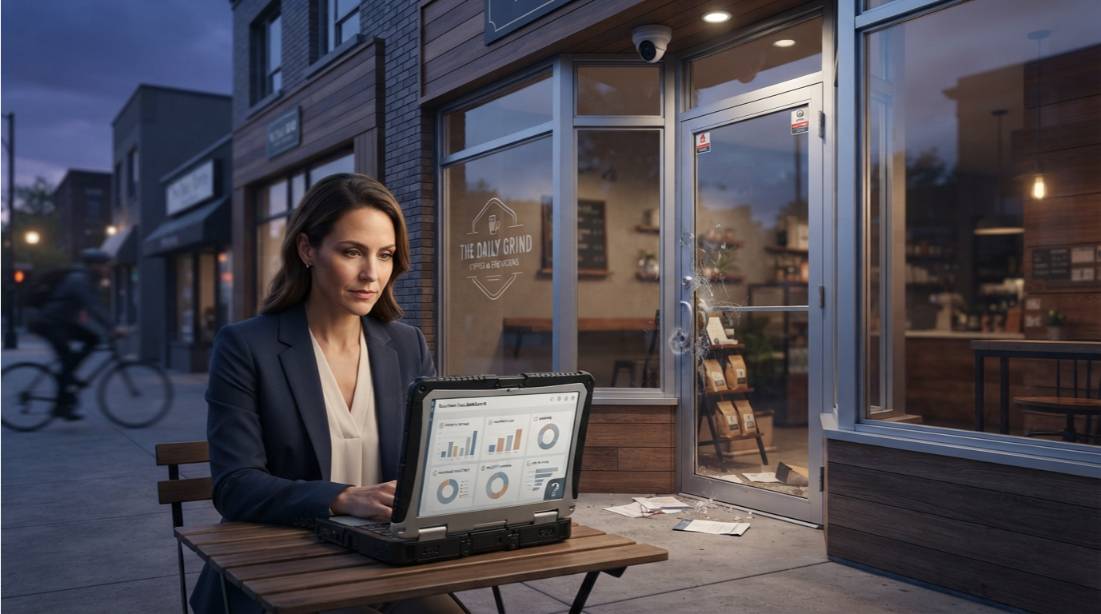
Two-thirds of North American businesses were hit by a break-in, forced entry, or vandalism incident in the past three years. The average cost of a single incident has climbed to $28,000, a 47% increase since 2022. And the security measure most businesses are depending on to protect them? Surveillance cameras. A tool that 91% of professional security consultants say is insufficient to stop a determined attacker.
That is the central finding of this report and it defines the problem the industry needs to confront in 2026.
Talius surveyed 1,247 retailers, property managers, and independent security consultants across the United States and Canada between January and March 2026. The goal was straightforward: understand how North American businesses are actually protecting their commercial properties, identify where the most dangerous gaps exist, and let the data speak without agenda.
What the data reveals is a profession-wide perception problem. Business owners believe they are protected. The professionals who assess security for a living and who clean up after the incidents know they are not.
Four findings define this year’s report:
- 67% of respondents experienced at least one break-in or vandalism incident in the past three years, up from 58% in our 2023 equivalent survey
- The average total cost of a single commercial break-in is now $28,000, when insurance premium increases, emergency repairs, downtime, and reputational damage are included
- 54% of retailers identify surveillance cameras as their primary and in most cases, only physical deterrent
- 91% of security consultants say cameras alone are insufficient to prevent forced entry or smash-and-grab attacks
The gap between those last two numbers is the story of this report.
Who We Surveyed
Total respondents: 1,247 Survey format: Independent online survey Survey period: January – March 2026 Geographic coverage: 38 U.S. states and 8 Canadian provinces
Respondent breakdown:
- Retailers: 44% (n=549) – storefront owners, franchise operators, and multi-location retail managers responsible for day-to-day property security decisions
- Property managers: 31% (n=387) – commercial and mixed-use building managers overseeing between 1 and 20 properties
- Security consultants: 25% (n=311) – independent professionals who assess, specify, and oversee security solutions for commercial and institutional clients on a fee basis
Respondents were screened for active commercial property involvement. Retailers were required to operate a minimum of one customer-facing commercial premises. Property managers were required to actively manage at least one income-producing commercial property. Security consultants were required to have provided paid security assessments or specifications within the previous 12 months.
Geographic respondents skewed toward urban and suburban commercial corridors, with higher representation from the Pacific Northwest, Ontario, California, Texas, and the Mid-Atlantic states regions that have seen above-average growth in organised retail crime in recent years.
Margin of error: ±2.8% at the 95% confidence level.
Section 1: The State of Retail Security in 2026
Incident rates are climbing – and so is the cost
The headline number from this year’s survey is not the one most businesses want to see.
67% of respondents experienced at least one break-in, forced entry, or vandalism incident in the past three years. That figure is up from 58% in our 2023 data – a nine percentage point increase in two years. Among standalone urban storefronts, the number climbs to 79%.
Vandalism and graffiti tell a similar story. 72% of retailers reported at least one graffiti or vandalism event in the past 12 months. Among businesses operating in mixed commercial-residential corridors, that number was 81%.
The businesses most frequently targeted by break-in and forced entry incidents in our survey:
- Pharmacies and health product retailers: 84% incident rate
- Jewelry and luxury accessories: 81%
- Convenience stores and 24-hour operators: 78%
- Electronics and mobile device retailers: 76%
- Liquor and specialty beverage: 74%
- General grocery and food retail: 61%
The pattern is consistent with national crime data: high-value portable merchandise, accessible entry points, and predictable operating hours make certain retail categories disproportionately attractive targets.
The true cost of a single incident
Ask most business owners what a break-in costs and they will quote you the value of stolen merchandise. That figure is real. It is also, in almost every documented case, the smallest part of the total financial damage.
When respondents who had experienced an incident were asked to itemise their actual losses across all cost categories, the picture looked like this:
Direct costs:
- Inventory and merchandise loss: reported by 91% of incident survivors
- Emergency repairs glass, doors, shutters, structural damage: reported by 84%
Indirect costs incurred within 12 months of the incident:
- Insurance premium increase: reported by 77%
- Unplanned staff overtime to manage the aftermath: reported by 63%
- Revenue loss from temporary closure or reduced operating hours: reported by 58%
Long-term costs:
- Lasting damage to customer trust and repeat footfall: reported by 41%
The average total incident cost across all categories: $28,000.
That compares to an average of $19,000 in equivalent data from 2022 a 47% increase in three years. The growth is not driven primarily by higher merchandise values. It is driven by the escalating cost of emergency repairs, the duration of business disruption, and the steepening of insurance premium adjustments following incidents.
We thought the stolen merchandise was the worst of it. The real hit came from three months of higher insurance premiums, emergency shutter installation costs, and the customers who just stopped coming in. We estimate the total cost was somewhere between $35,000 and $40,000. The stolen stock was maybe $6,000.” Retail pharmacy owner, Greater Vancouver, BC
The hidden cost most businesses never calculate
Beyond the measurable financial categories, three consequences surfaced repeatedly in qualitative responses that rarely appear in incident cost calculations.
Repeat targeting. Businesses that experienced one break-in were 2.3 times more likely to experience a second within 18 months. This pattern well-documented in commercial crime research — reflects the reality that successful entry points are communicated within criminal networks. A business that has been broken into once is, without intervention, a known quantity.
Staff confidence and retention. 44% of respondents who experienced a break-in reported that at least one member of staff either reduced their hours, requested a schedule change away from opening or closing shifts, or resigned within three months of the incident. The psychological impact of working in a space that has been violated is a real and underreported operational cost.
Customer perception. 41% reported lasting reputational damage. But the qualitative data tells a more granular story. Several respondents noted that boarded windows, visible repair work, and the general appearance of a business that had been targeted were enough to reduce foot traffic for weeks or months even after physical repairs had been completed. Perception of security is itself a commercial asset.
Section 2: How Businesses Are Currently Protecting Themselves
What security measures are in use
Respondents were asked to identify every security measure currently deployed at their primary commercial premises, and then to identify which one they considered their primary deterrent. The results reveal a security landscape dominated by passive monitoring tools and largely absent of physical prevention measures.
Security measures currently deployed (all respondents):
- Surveillance cameras: 87%
- Alarm systems: 74%
- Security lighting: 61%
- Staff security protocols (key holder procedures, closing checklists): 49%
- Physical barriers (roll shutters, security grilles, gates): 31%
- Professional security guard or monitoring service: 18%
- No formal security measures: 6%
Camera deployment is near-universal. Physical barrier deployment sits at 31% meaning nearly seven in ten businesses have no physical mechanism to prevent or delay forced entry after hours.
Primary deterrent (single selection):
- Surveillance cameras: 54%
- Alarm systems: 22%
- Physical barriers: 14%
- Security guard / monitoring service: 7%
- Other: 3%
More than half of all respondents 54% identified surveillance cameras as their primary deterrent. That is the number security consultants found most alarming.
The camera dependency problem
The commercial security industry has spent two decades marketing surveillance cameras as the cornerstone of business protection. That marketing has been extraordinarily effective. It has also, according to the professionals in this survey, left a significant portion of North American retail exposed in ways many business owners do not fully understand.
The critical distinction that 91% of security consultants in this survey emphasised directly:
Cameras record crimes. Barriers prevent them.
A surveillance camera regardless of resolution, field of view, or monitoring arrangement — does not physically impede an attacker. In a smash-and-grab scenario, where the average time from first impact to exit is under 90 seconds, a camera provides law enforcement with evidence after the fact. It provides the business with nothing during the event itself.
Security consultants were asked to assess the deterrent effectiveness of cameras against four types of commercial crime:
- Opportunistic shoplifting: cameras rated effective or very effective by 79% of consultants
- After-hours break-in by a single actor: cameras rated effective or very effective by 31%
- Organised smash-and-grab: cameras rated effective or very effective by 9%
- Organised retail crime (multi-actor coordinated entry): cameras rated effective or very effective by 6%
The deterrent value of cameras is real but it is concentrated at the low end of the threat spectrum. Against the incident types that generate the largest losses, cameras offer minimal protection.
I’ve been doing commercial security assessments for 14 years. The most common thing I see is a business that spent $8,000 on a camera system and $0 on anything that would actually stop someone from getting in. The cameras are excellent. They document everything in high definition. And the owner can watch the footage of their store being emptied on their phone in real time. That’s not security. That’s a very expensive way to watch a crime happen.” Independent security consultant, Dallas, TX
The awareness gap
Beyond the camera dependency issue, the survey revealed a substantial awareness problem among retailers.
55% of retailers who had not installed physical barriers said they were unaware that modern roll shutter or physical barrier options existed for their type of storefront. A further 38% said they had assumed physical barriers were only appropriate for large-format retail, industrial facilities, or high-crime urban areas.
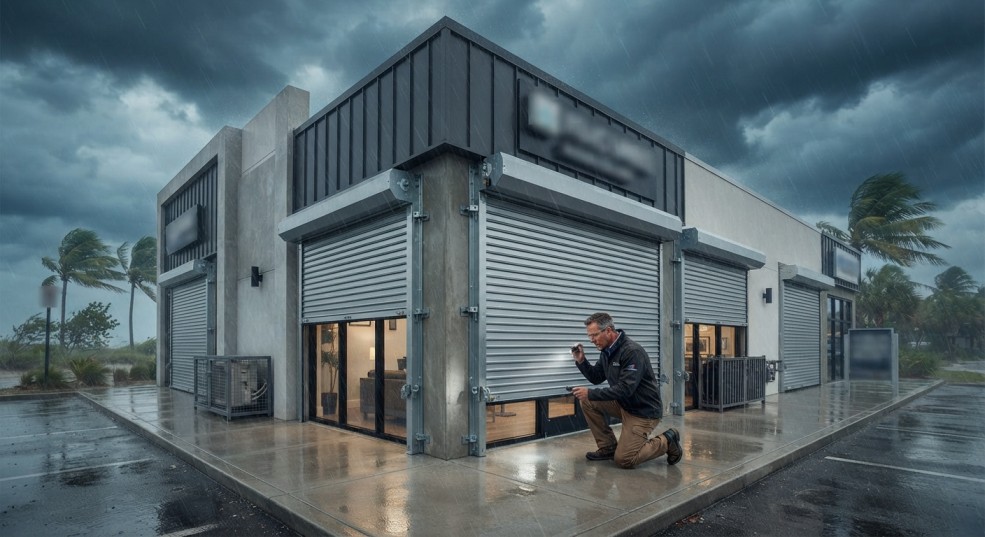
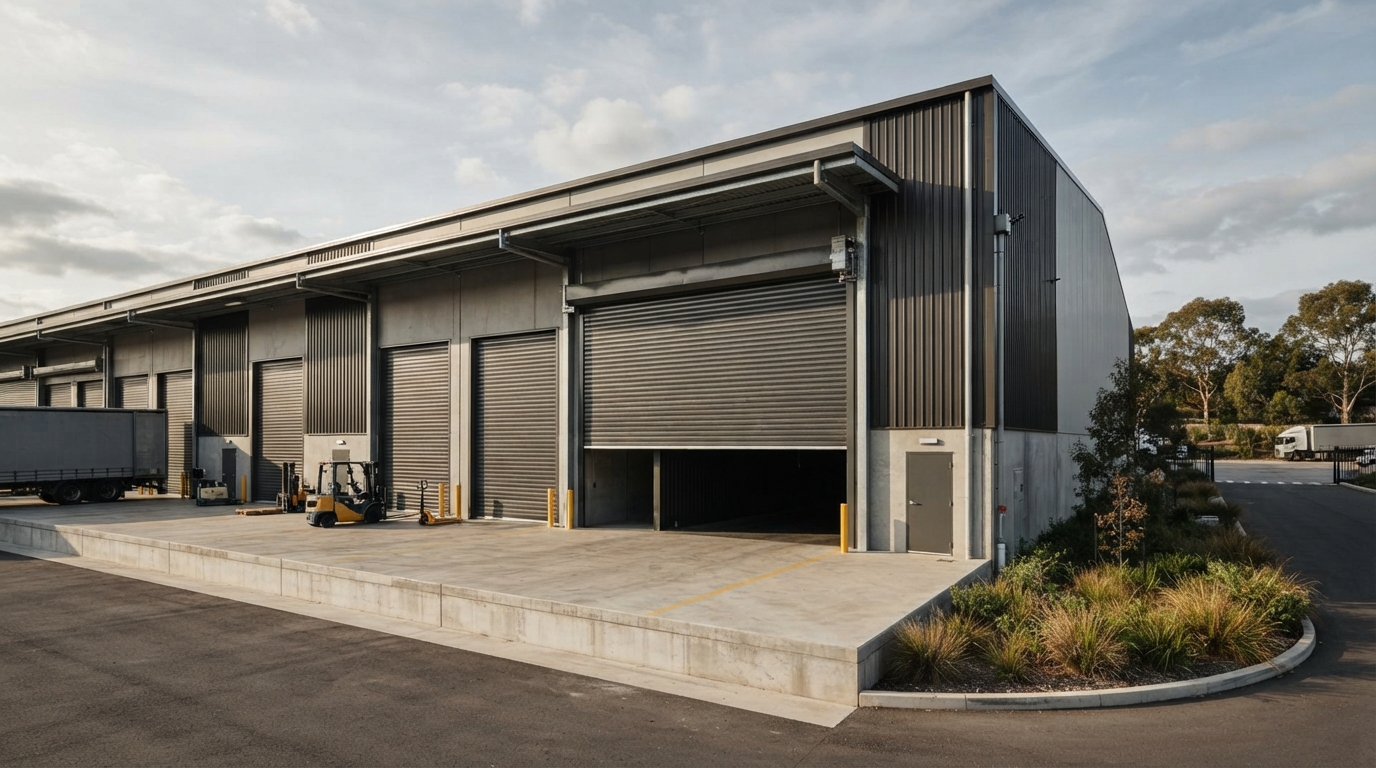
This perception that physical barriers are either unavailable or inappropriate for standard commercial retail is both widespread and inaccurate. Modern roll shutters are manufactured to custom dimensions for any opening size. They are available in motorised configurations that integrate with building automation systems. They can be finished with custom graphics, brand colours, and anti-graffiti coatings. They are deployed in everything from boutique jewelry stores to suburban pharmacies to institutional school buildings.
The majority of businesses surveyed that had not explored physical barrier options simply had never been presented with one.
Section 3: Findings by Audience Segment
Retailers: The most exposed, and the most underprotected
Retailers represented the highest incident rates, the lowest physical barrier adoption, and the greatest gap between perceived and actual security readiness of any segment in this survey.
Top three security concerns among retailers heading into 2026:
- Smash-and-grab incidents and organised retail crime (cited by 68%)
- Overnight break-ins through unprotected glass entry points (cited by 61%)
- Graffiti and vandalism (cited by 54%)
Primary reasons retailers have not invested in physical barriers:
- Upfront cost perceived as too high: 69%
- Unaware of available modern options: 55%
- Believe cameras provide adequate protection: 54%
- Concerned about aesthetics and curb appeal: 43%
- Difficulty finding a qualified installer: 31%
What finally changed their minds – among retailers who did invest:
The survey asked retailers who had installed physical barrier solutions in the past three years what prompted the decision. The answers were uncomfortably consistent:
- 61% said the decision followed directly from a break-in or serious vandalism incident
- 22% said an insurance renewal conversation including a premium increase or coverage restriction prompted them to act
- 11% said advice from a security consultant or commercial property advisor
- 6% said they acted proactively, before any incident occurred
The data is a clear signal: most businesses are waiting for an incident to happen before they invest in the prevention that would have stopped it. The most common regret cited by retailers post-installation? Waiting until after the first break-in.
Property managers: Security is now the number one tenant concern
For property managers, the survey data reflects a fundamental and accelerating shift in what commercial tenants expect from the properties they occupy.
79% of property managers said security is now their tenants’ single most frequently cited concern — ahead of parking availability, maintenance response times, and even rent pricing. In equivalent data from 2019, that figure was 51%. In six years, security has moved from a mid-tier tenant concern to the number one issue on the list.
The liability dimension is increasingly front of mind. 47% of property managers surveyed said they had received a formal complaint from a commercial tenant citing inadequate building security following an incident in the past two years. 22% said a tenant had cited security as the primary reason for not renewing a lease.
Yet investment in physical security has not kept pace with the demand:
- Only 37% of property managers have undertaken an exterior physical barrier upgrade in the past three years
- 64% cited budget approval processes as their primary obstacle to implementing improved physical security
- 52% said they would specify roll shutters or comparable physical barrier systems in new commercial build specifications but retrofitting existing properties remains a significantly lower priority
The tension between rapidly escalating tenant security expectations and multi-layer capital expenditure approval timelines is creating a vulnerability window across the commercial property sector. In several documented cases in this survey, that window is being exploited.
How property managers are overcoming the budget obstacle:
Among the 37% who had successfully funded and completed physical security upgrades, three strategies dominated:
- Framing security upgrades as dual-purpose investments with measurable energy efficiency ROI, enabling access to sustainability capital budgets: cited by 48%
- Documenting the projected cost of a single incident including liability exposure against the installation cost: cited by 39%
- Leveraging insurance provider incentives or premium reductions available for certified physical barrier installations: cited by 31%
The dual-purpose framing security and energy efficiency was by far the most effective route to budget approval.
Security consultants: The professionals who see what happens when security fails
Security consultants were the most unambiguous segment in this survey. Their professional position engaged after incidents, before them, and in the forensic analysis of what went wrong gives their responses a clarity that neither retailer nor property manager data can match.
What consultants recommend, in order:
- Physical barriers on all after-hours vulnerable entry points (recommended first by 88% of consultants)
- Integrated alarm systems connected to monitored response (recommended second by 81%)
- Surveillance and camera systems (recommended third by 76%)
- Environmental deterrents lighting, visibility management (recommended fourth by 64%)
The ordering matters. In a discipline that has been dominated for years by camera-first thinking, 88% of working security consultants are now leading their recommendations with physical barriers. Cameras come third.
On the ROI conversation:
55% of security consultants said they now routinely include energy efficiency ROI in their client proposals, a significant shift from 2022 data, where that figure was 29%. The reason is practical: security budgets have ceilings. Dual-purpose investments, shutters that provide both security and insulation value, habitat screens that deliver UV protection and reduced cooling costs alongside perimeter protection access a broader pool of capital. Framing physical security as a building efficiency investment as well as a protection measure is increasingly how consultants are getting approvals that a pure security spend would not unlock.
On automation:
83% of consultants prefer automated, motorised systems over manual physical barriers in their specifications. The reason cited most frequently: compliance consistency. A manual shutter that depends on a staff member remembering to close it at 10 PM is a manual shutter that will eventually be left open. Automation removes the human error variable entirely and in insurance conversations, the difference between a manual and automated system is increasingly reflected in premium calculations.
Section 4: The Five Barriers to Better Physical Security
The survey asked every respondent who had not installed a physical barrier system why they had not done so. Five obstacles accounted for the overwhelming majority of responses. Each one is addressable. Most of them are based on incomplete or outdated information.
Barrier 1: Upfront cost is perceived as prohibitive – cited by 69%
Cost was the most cited barrier across all three segments. It is also the barrier most directly contradicted by the financial data in this survey.
Businesses that installed roll shutter or physical barrier systems reported average annual savings of $4,200, a composite figure drawn from three sources: reduced insurance premiums, measurable energy cost reductions from improved insulation, and reduced incident-related claims and repair costs.
At average installation costs for a standard commercial storefront, most businesses recover their investment within two to four years. Businesses in high-incident categories pharmacies, jewelry, electronics reported payback periods as short as 14 months.
The perception of cost as a barrier is almost universally based on an incomplete calculation. Businesses are comparing the installation cost of a physical barrier to zero, the cost of not installing one. The accurate comparison is installation cost against the annualised cost of the incidents, insurance increases, and remediation expenses they are currently absorbing. When that calculation is made in full, the economics of physical barriers are not a barrier at all.
Barrier 2: Aesthetic concerns – cited by 43%
43% of non-adopters said they had ruled out physical barriers because of assumptions about how they would affect their storefront appearance.
This perception is almost entirely based on an outdated mental image of what commercial roll shutters look like. The corrugated steel shutters of 20 years ago industrial in appearance, indifferent to context bear little resemblance to the products available today.
Modern roll shutters are manufactured to specification for any opening size. They are available in motorised configurations that retract completely out of sight when not deployed. They can be finished in any RAL colour, printed with custom graphics, brand logos, or promotional designs, and coated with anti-graffiti treatments that make them easier to maintain than an unprotected storefront.
78% of businesses that installed modern roll shutters said the installation either enhanced their storefront appearance or had no negative impact on it. 14% said it had a noticeable positive impact on brand presentation. The aesthetic concern, for the overwhelming majority of businesses that have actually gone through installation, does not survive contact with the reality of the product.
Barrier 3: The belief that cameras are enough – cited by 54%
This is the most consequential of the five barriers because it is the one most likely to result in a serious financial incident.
The data from security consultants in this survey is direct. 91% say cameras are insufficient to prevent forced entry or smash-and-grab attacks against businesses that are specifically targeted. Real incident data from businesses in this survey who relied solely on cameras tells the same story: of the 67% who experienced a break-in in the past three years, 71% had surveillance cameras deployed and operational at the time of the incident.
The cameras documented the crime. They did not prevent it.
Cameras are a valuable component of a layered security system. They are not a substitute for a physical barrier at the point of entry. This distinction widely understood in the professional security community, largely absent from the mainstream retail security conversation is the single most important information gap this report seeks to close.
Barrier 4: Unawareness of what modern solutions actually offer – cited by 55%
More than half of non-adopters had simply never been accurately informed about what contemporary physical barrier solutions can do.
The specific assumptions most frequently cited by respondents who later changed their position after learning more:
- “I thought they were only for large stores or malls” – modern roll shutters are manufactured to dimension for any opening, from a single door to a full shopfront spanning 30 metres
- “I thought they looked like industrial metal grilles” – contemporary systems offer a range of profile options, powder coat finishes, and custom print surfaces
- “I didn’t know they could be automated” – motorised systems with remote control, smartphone integration, and building automation compatibility are standard options
- “I didn’t know they could also help with energy costs”- insulated shutter profiles and habitat screen products reduce heat gain, heat loss, and UV penetration materially
Each of these assumptions, when corrected, changed the respondent’s assessment of physical barriers as a viable option. The education gap is not intractable. It is largely a distribution problem most businesses simply have not had a direct conversation with a knowledgeable dealer.
Barrier 5: Difficulty finding a qualified installer – cited by 31%
A smaller but significant portion of respondents said they had investigated physical barrier options but were unable to identify a manufacturer-certified installer in their area.
This is a distribution awareness problem rather than a supply problem. The certified dealer and installation network for major roll shutter manufacturers has expanded substantially across North America in recent years. The challenge is that awareness of that network has not kept pace with its growth.
When seeking a qualified installer, security consultants recommend prioritising:
- Manufacturer certification and authorised dealer status
- Demonstrated experience with commercial (not only residential) installations
- Ability to specify custom dimensions and automation integration
- Familiarity with insurance documentation requirements for physical barrier installations
- Post-installation support and warranty service capacity
Section 5: What Businesses That Got It Right Have in Common
The survey identified 387 respondents who had installed physical barrier solutions within the past three years and asked them to report outcomes across five categories. The results are consistent enough to constitute a pattern.
Security outcomes:
- 89% reported zero successful forced entry incidents since installation
- 76% reported that visible physical barriers had reduced the frequency of attempted vandalism at their property
- 94% said they would recommend physical barrier solutions to other business owners
Financial outcomes:
- 77% saw a measurable reduction in insurance premiums within the first 12 months of installation
- Average annual insurance saving: $1,840
- Average annual energy cost reduction attributable to improved insulation and solar shading: $1,950
- Average annual reduction in incident-related repair and remediation costs: $620
- Combined average annual financial benefit: $4,410
Operational outcomes:
- 68% reported a measurable reduction in heating and cooling costs attributable to insulated shutters or habitat screens
- 71% reported improved staff confidence about opening and closing procedures
- 44% reported a positive change in customer perception of the premises
The automation advantage:
Among businesses that installed motorised versus manual systems, outcomes diverged in one specific area: compliance consistency. Businesses with motorised automated systems reported 97% barrier deployment compliance on closing meaning the shutters were confirmed closed at the end of every business day. Businesses with manual systems reported 84% compliance. That 13-point gap represents the nights the shutter was not closed. In a 365-day year, it represents approximately 47 nights of unprotected entry points.
The common thread across all high-performing installations:
Businesses that achieved the best outcomes fewest incidents, fastest ROI, highest staff and customer satisfaction shared three characteristics:
- They installed physical barriers before an incident, not in response to one
- They chose motorised, automated systems over manual alternatives
- They worked with a manufacturer-certified dealer who specified the correct product for their specific opening dimensions and risk profile
The businesses that waited installed physical barriers only after their first serious incident — uniformly reported that the installation cost was recovered in the first year through avoiding second incidents alone. The regret, consistently, was the same: they wished they had done it sooner.
Section 6: Expert Recommendations for 2026
Based on the survey findings and the qualitative input of the 311 security consultants in this survey, six recommendations emerge for businesses assessing their physical security posture before year-end.
Recommendation 1: Layer your defences – don’t mistake one tool for the whole system.
Cameras, alarms, and physical barriers each do something different. Cameras create accountability and evidentiary records. Alarms create an audible deterrent and trigger monitored response. Physical barriers prevent or delay entry. A business with only one of these three layers is operating with significant blind spots. The goal in 2026 is not to choose the best single tool, it is to ensure all three layers are present and integrated.
Recommendation 2: Automate your most vulnerable entry points.
If a security measure depends on a human being remembering to activate it at the end of every business day, it will eventually fail. Motorised roll shutters connected to building automation systems or even to a simple remote activation protocol eliminate that failure mode. Automation is not a luxury feature. In the context of commercial security, it is a compliance mechanism.
Recommendation 3: Calculate the full cost of an incident before making a budget decision.
Before a security investment is evaluated solely on installation cost, calculate what a single incident would cost the business in full including emergency repairs, insurance premium increases across 12 months, revenue loss from downtime, and staff and customer impact. For the majority of businesses in the incident-prone categories surveyed, that calculation changes the conversation from “can we afford this” to “can we afford not to.”
Recommendation 4: Specify anti-graffiti coatings on every exterior installation.
Businesses that installed anti-graffiti coatings on their exterior shutters and surfaces reported remediation cost reductions of up to 80% compared to pre-installation averages. Beyond cost, the coating functions as a deterrent in its own right; surfaces that cannot be permanently tagged are less attractive to vandals. The incremental cost of anti-graffiti coating at time of installation is a fraction of a single remediation job.
Recommendation 5: Include energy efficiency in your security budget conversation.
Insulated roll shutters and habitat screen products reduce heat gain in summer, heat loss in winter, and UV penetration year-round. LEED certification credits are available for qualifying installations. For businesses in climates with significant seasonal temperature variation which covers most of North America, the energy savings component of a physical barrier installation can represent 40–50% of the total annual financial benefit. This is not a footnote to the security case. It is a parallel investment return that should be calculated and presented when seeking budget approval.
Recommendation 6: Conduct a formal security audit every 12 months.
67% of break-in incidents in this survey occurred at entry points that had been previously assessed as low risk. Threat profiles change. Staffing patterns change. Criminal activity in commercial corridors shifts seasonally and geographically. A security assessment that was accurate 18 months ago may not reflect the current risk profile of a property. Annual audits are not a bureaucratic exercise, they are the minimum required to keep pace with a changing threat environment.
Section 7: Security Trends to Watch in 2026
The survey asked security consultants to identify the developments they expect to most significantly shape the commercial security landscape in the coming 12 to 18 months. Five themes dominated their responses.
The continued rise of organised retail crime.
Smash-and-grab incidents carried out by coordinated multi-actor groups rather than individual opportunistic actors are the fastest-growing segment of commercial property crime in both the United States and Canada. These incidents are characterised by speed (typically under two minutes from first entry to exit), coordination, and a specific targeting methodology that identifies properties with unprotected glass entry points and high-value portable merchandise. Physical barriers are the only reliable countermeasure against this threat profile. Cameras provide documentation. Physical barriers provide prevention.
Building automation integration is becoming standard.
The integration of security systems including motorised roll shutters into broader smart building infrastructure is accelerating. New commercial developments are increasingly specifying automated physical barrier systems as standard rather than optional components, connected to the same building management systems that control HVAC, lighting, and access control. For existing commercial properties, retrofit integration options are expanding. Businesses that install motorised barrier systems today are well-positioned to integrate them into broader automation infrastructure as it becomes available.
Insurance underwriters beginning to mandate physical barriers.
Several major commercial property insurance underwriters in the United States and Canada have introduced or piloted coverage provisions that either require physical barrier installations on high-risk property categories as a condition of coverage, or that offer meaningful premium reductions for certified installations. Security consultants surveyed expect this trend to accelerate. For businesses in high-incident categories pharmacies, jewelry, electronics, the insurance conversation in 2026 and beyond will increasingly involve the question of what physical barriers are deployed, not just what cameras and alarms are present.
Commercial building code evolution around energy performance.
Tightening commercial building energy codes in several Canadian provinces and U.S. states are making insulated exterior products including qualified roll shutters and shading systems relevant to building compliance conversations, not only security ones. For property managers and commercial developers, this evolution means that products previously evaluated only as security investments are beginning to appear on energy efficiency audits and compliance checklists. The dual-use case for physical barrier products is becoming a regulatory reality in addition to a financial one.
The aesthetic evolution of physical barrier products.
The next generation of roll shutter and habitat screen technology is being designed with storefront-first aesthetics as a primary design constraint, not an afterthought. Product development across the physical barrier industry is increasingly oriented toward architects, designers, and retail brand teams, not only security specifiers. Custom print surfaces, slim-profile housing systems, and facade-integrated designs are redefining what exterior security products look like when deployed. The aesthetic barrier to adoption, already contradicted by current product reality, will continue to diminish as the design language of physical security products converges with the design language of high-end commercial architecture.
Bottom Line
The data in this report tells a story that the commercial security industry has been circling for years without fully confronting.
North American businesses are spending money on security. They are spending it on tools that document crime rather than prevent it, in a threat environment that is evolving faster than most security strategies are adapting to it. The gap between what business owners believe is protecting them and what security professionals know actually works is measurable, costly, and crucially closeable.
Physical barriers are not a new technology. They are not an emerging solution awaiting proof of concept. They are a proven, widely deployed, increasingly sophisticated category of commercial building product with a documented track record of preventing incidents, reducing insurance costs, improving energy performance, and delivering measurable financial return. The businesses that have installed them know this. The businesses that have not, largely, simply have not yet had the right conversation.
This report is an invitation to have that conversation.
For retailers: The question is not whether you can afford a physical barrier system. It is whether you can afford to absorb a $28,000 incident, and the second one that statistically follows it within 18 months without one.
For property managers: Your tenants are already telling you what they need. Security is their number one concern. The businesses that close the gap between tenant expectation and building reality fastest will retain the best tenants longest.
For security consultants: The data supports what you are already recommending. Physical barriers first. Cameras third. The evidence base for that sequencing has never been stronger.