An Authoritative Data Report for Business Owners, Insurance Professionals, Security Consultants, and Policymakers
Published 2026 | Sources: FBI Crime in the United States 2024, The Hartford Small Business Claims Analysis 2025, Canadian Federation of Independent Business (CFIB), Statistics Canada, Guardian Protection, Statista, and Insurance Bureau of Canada
Introduction: The Bill Nobody Budgets For
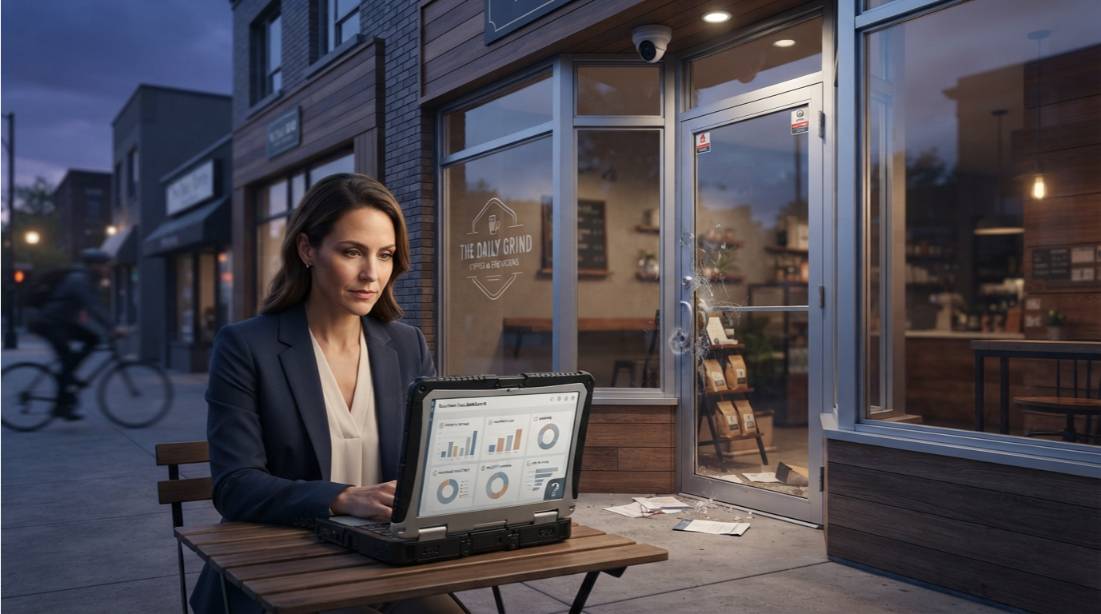
Every small business owner runs a mental risk register, the supplier who might miss a delivery, the lease renewal that might go badly, the slow season that might stretch too long. Most of them do not have a line item for what happens the morning they arrive to find a broken door, a ransacked stockroom, and a cash drawer that has been emptied.
They should.
In 2023, 42,508 commercial properties and office buildings were burglarized across the United States. Restaurants were hit 23,358 times. Construction sites 12,979 times. Discount stores 12,283 times. Convenience stores 12,397 times. These are not abstract categories. They are the businesses that line every main street and strip mall in North America, the places owned by people who took out loans, hired staff, and built something. Guardian Protection
And yet the number that most small business owners cite when asked what a break-in costs — “a few thousand dollars” captures only the most visible fraction of the actual damage. The stolen cash. The smashed display case. The broken rear door. What it does not capture is the insurance deductible, the premium increase that follows the claim, the days of lost revenue during cleanup and repairs, the staff hours diverted from sales to documentation, the long-term customer trust that quietly erodes when word spreads that a business was victimized.
This report documents the full cost of a commercial break-in for small businesses in the United States and Canada not the advertised average that appears in insurance brochures, but the layered, compounding total that business owners actually absorb in the months that follow.
Key Findings at a Glance
Eight data points from this report deserve immediate attention before the full analysis unfolds.
- Burglary and theft is the single most common insurance claim filed by small businesses, impacting 20% of small business owners across a five-year analysis of more than one million policies.
- The average burglary and theft insurance claim costs $8,000 but this figure represents only the insured loss, not the full cost of the incident.
- The share of Canadian small businesses directly affected by crime nearly doubled in a single year, rising from 24% in 2023 to 45% in 2024, according to the Canadian Federation of Independent Business.
- Restaurants are the most burglarized business type in the United States, with 23,358 incidents reported, nearly double the number recorded at convenience stores.
- Filing a theft claim can lead to increased insurance premiums or, in some cases, the risk of policy nonrenewal, a long-term cost that extends far beyond the immediate incident.
- In Canada, half of small business owners reported that crime increased in their community in 2025, while only 2% reported a decrease, according to CFIB’s October 2025 survey of 2,542 businesses.
- The average cost of a fire claim for small businesses reached $80,000 in 2025 — more than double the 2015 figure of $35,000, illustrating how rapidly the cost of physical property incidents is escalating.
- Police-reported shoplifting of $5,000 or under rose 14% in Canada in 2024 compared to 2023, marking the fourth consecutive annual increase and a 66% surge since 2014.
Part I — The Immediate Costs: What Every Break-In Bill Includes
The first cost layer of a commercial break-in is the most visible — and the one most frequently underestimated even at the scene of the incident.
Stolen Property and Inventory
The most obvious component of break-in cost is whatever was taken. For a retail business, this means inventory. For a restaurant, it means cash, equipment, and food product. For a contractor or trade business, it means tools, materials, and equipment that may be stored on-site.
The average small business burglary and theft insurance claim is $8,000, based on The Hartford’s analysis of more than one million property and liability policies over five years. That figure is a meaningful data point, but it is important to understand what it measures: the insured value of what was taken or destroyed, as documented for a claims payment. It does not capture losses that fall below the deductible. It does not capture items that were stolen but not listed in the initial police report. And it does not capture the many costs that follow the immediate theft event.
For businesses in high-value merchandise categories electronics, jewelry, pharmaceuticals, specialty tools a single break-in can produce losses that dwarf the average claim. The average claim figure pulls across thousands of incidents in lower-value categories and compresses the distribution. Business owners in high-value categories should not assume the average represents their exposure.
Physical Damage: Entry Point, Interior, and Systems
Break-ins inflict damage that extends well beyond the entry point. A burglar who forces a rear door will damage the door frame, the lock mechanism, and potentially the door itself. If a window was the point of entry, the glass, frame, and surrounding wall or sill may all require repair. Security cameras, alarm panels, and access control hardware are frequently targeted and destroyed during a break-in to reduce evidence and delay detection.
The cost of physical damage frequently exceeds the cost of stolen goods in commercial break-ins -particularly when the entry required forced penetration of a secured door or reinforced window. Emergency board-up and temporary security costs, incurred immediately after the break-in to prevent secondary entry before permanent repairs are made, can add $500 to $2,000 to the immediate cost before any repair work begins.
Business owners should wait to discuss permanent repairs with their insurer before beginning work. While temporary repairs to broken windows and locks can be initiated immediately, expensive permanent repairs should be coordinated with the insurance claim to avoid disputes over coverage and cost.
The Deductible Problem
Most small to medium businesses pay between $500 and $3,000 annually for commercial property insurance with theft coverage. Commercial property insurance deductibles typically range from $500 to $2,500 for small business policies. When the immediate cost of a break-in falls near or below the deductible, a common scenario for smash-and-grab incidents where the loss is focused on a narrow category of merchandise, the owner bears the full cost without insurance recovery.
This deductible threshold creates a systematic undercount of break-in costs in the insurance data: claims that fall below deductible are never filed, never recorded, and never appear in industry averages. The true frequency and cost of small-scale commercial break-ins is therefore higher than insurance claim data suggests.
Part II — The Hidden Cost Layers That Compound Over Months
The immediate costs of a break-in are finite. They appear in the days and weeks following the incident and can be documented, claimed, and resolved. The hidden cost layers are more durable and more damaging to the long-term financial health of a small business.
Layer 1: Business Interruption and Lost Revenue
A burglarized business does not always close the next day. But it is rarely operating at full capacity. The morning after a break-in, the owner is on the phone with police, the insurance company, and emergency repair contractors rather than serving customers. Staff are occupied with inventory counts, damage documentation, and statement-giving rather than their normal functions. In businesses that depend on foot traffic retail shops, cafés, restaurants every hour of reduced capacity or delayed opening translates directly into lost revenue.
Until stolen or damaged equipment is repaired or replaced, daily operations can be partially or fully paralyzed. This downtime directly leads to missed project deadlines, broken customer commitments, and an immediate halt in revenue that cannot be recovered. Competitors gain market share while affected businesses struggle to restore normal operations.
For businesses where specific equipment was stolen point-of-sale systems, kitchen equipment, industrial tools, the interruption period extends through the procurement and installation of replacements. Lead times for commercial equipment can run two to six weeks in 2026, depending on product category and supply chain conditions. A restaurant that loses its commercial refrigeration to a break-in is not simply out the cost of replacement, it is closed or operating at severely reduced capacity until replacement arrives.
Layer 2: Insurance Premium Increases and Coverage Changes
Filing a theft claim can lead to increased insurance premiums or, in some cases, the risk of nonrenewal. This is the cost that most small business owners do not factor into their break-in calculation at all — and it is one of the most financially significant.
An insurance premium increase following a commercial theft claim can range from 5% to 25% depending on the insurer, the claim amount, the business’s prior claims history, and the assessed risk profile of the location. For a small business paying $1,500 per year in commercial property insurance, a 15% increase represents $225 per year in additional premium cost. Over a five-year period a reasonable minimum for a single claim’s influence on a policy, that adds $1,125 to the total cost of the break-in, even after the claim itself is resolved.
For businesses that experience two claims within a short period, or whose location is flagged as elevated risk following a break-in, the consequences can be more severe: higher deductibles imposed at renewal, reduced coverage limits, or outright nonrenewal that requires the business to seek coverage in the surplus lines market at significantly higher rates.
Layer 3: Staff Time and Productivity Loss
The labor cost of responding to a break-in is rarely calculated and almost never claimed. But it is real and it is substantial. The owner’s time spent with police, insurance adjusters, and contractors is time not spent managing the business. Staff time spent on inventory counts, damage documentation, and cleaning is time not spent serving customers or performing productive work.
An unsafe work environment carries a human cost that businesses often overlook. The psychological toll of repeated incidents affects both current performance and long-term retention. Anxious employees lose focus on core responsibilities. In businesses where staff have witnessed the aftermath of a break-in or, in the worst cases, where a break-in occurred during operating hours the psychological impact on employees can produce measurable effects on performance, absenteeism, and turnover that extend for months.
Layer 4: Security Upgrade Investment
A business that has been burglarized is statistically more likely to be burglarized again. This is not a popular statistic, but it is well-supported in the criminology literature: once a property has been identified as accessible by a criminal, it is frequently revisited either by the same offender or by others who learn of the successful entry point.
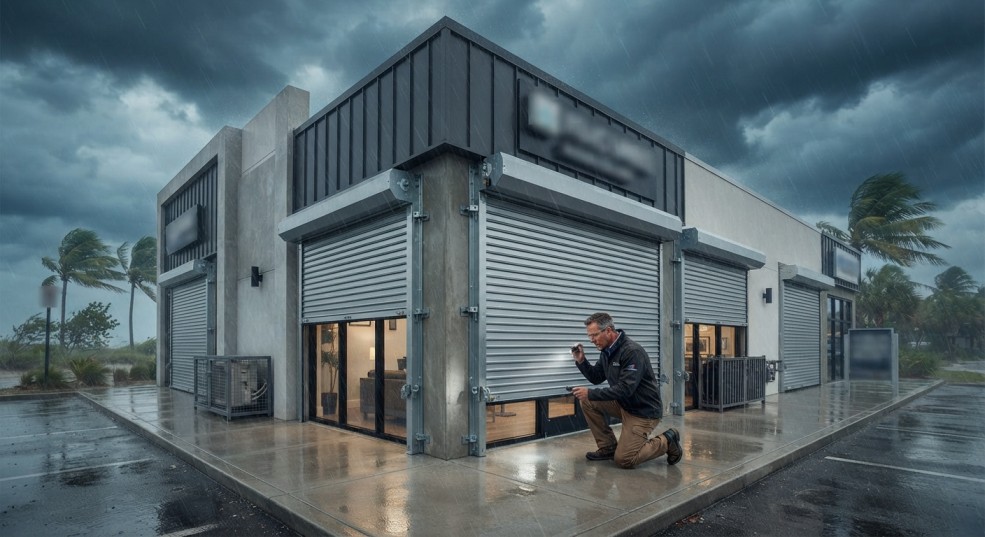
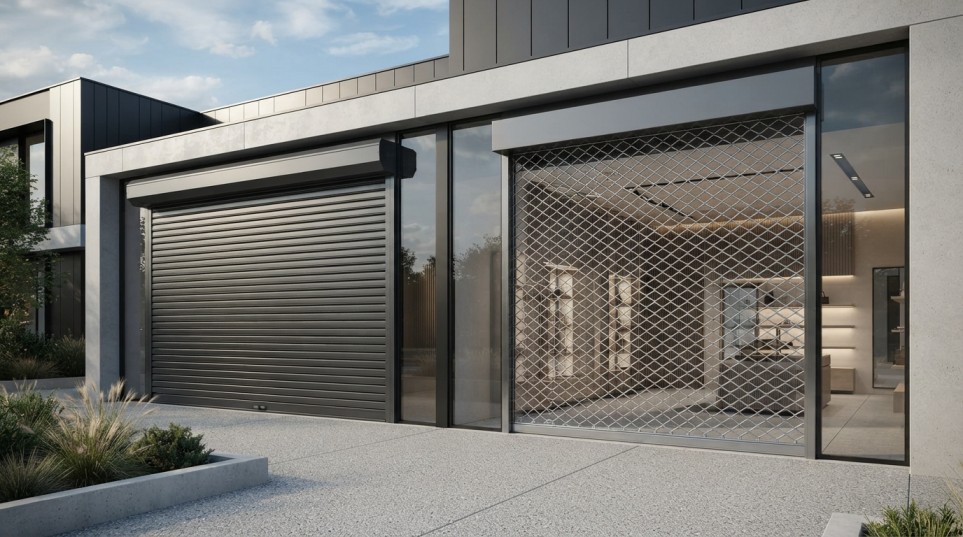
The rational response to a break-in is therefore to invest in the security infrastructure that should have been in place before the incident. This typically means upgraded locks and door hardware, security camera systems or improvements to existing cameras, alarm system upgrades, lighting improvements, and in many cases physical barriers such as roll shutters, security grilles, or reinforced door frames.
Some Canadian business owners have reported spending thousands of dollars on installing security cameras or replacing smashed windows following crime incidents expenditures that represent real capital investment drawn from operating budgets that were not planning for that outlay.
These post-break-in security investments are not covered by commercial property insurance, they are capital expenditures the owner absorbs entirely. When added to the immediate costs and the ongoing insurance premium impact, they can double the effective total cost of a single break-in event.
Layer 5: Customer Trust and Reputational Damage
The reputational cost of a commercial break-in is the most difficult to quantify and potentially the most durable. In a community retail environment, news of a break-in spreads quickly. Customers who hear about it will make their own assessments of what the incident means for the safety of the business, the reliability of its operations, and whether they want to continue patronizing it.
For food and beverage businesses, a break-in that compromises temperature-controlled storage or food safety conditions can trigger health inspection requirements that create additional operational hurdles. For professional services businesses where client confidentiality is paramount financial advisors, healthcare providers, legal offices a break-in that raises questions about records security can produce client departures that produce far more lasting financial damage than the immediate theft.
Part III — The Complete Break-In Cost Model
To make the full cost of a commercial break-in concrete, the following model calculates total estimated cost across all five layers for a representative small business. The scenario is a single break-in at a North American small retail business with annual revenues of approximately $400,000.
| Cost Category | Estimated Cost | Notes |
| Stolen inventory and cash | $4,000 – $8,000 | Based on The Hartford average claim of $8,000; varies widely by business type |
| Physical damage (doors, windows, hardware) | $800 – $3,500 | Emergency board-up + permanent repair |
| Security camera and alarm damage/replacement | $500 – $2,000 | Frequently targeted during break-in |
| Insurance deductible (owner’s portion) | $500 – $2,500 | Absorbed before insurance coverage applies |
| Lost revenue during disruption (2–5 business days) | $2,200 – $5,500 | Based on $400,000 revenue / 365 days = ~$1,095/day |
| Owner and staff labor — documentation, cleanup, coordination | $800 – $2,400 | 20–60 hours at $40/hour blended rate |
| Insurance premium increase over 3 years (est. 10–15%) | $450 – $1,350 | $1,500 annual premium × 10–15% × 3 years |
| Post-break-in security upgrades (cameras, locks, barriers) | $1,500 – $8,000 | Varies significantly by existing security posture |
| Customer trust / reputational impact | Unquantified | Potential for measurable revenue decline; not modeled |
| TOTAL ESTIMATED COST | $10,750 – $33,250 | Before reputational impact |
This is an original estimate calculated for this report using a combination of reported figures and applied assumptions. All component figures are sourced or estimated from data cited in this report. The total is not a published figure from any single source; it is a synthesis model designed to illustrate the full cost stack. Actual costs will vary significantly based on business type, location, security posture, and insurance coverage.
The central finding of this model is important: the widely cited average insurance claim of $8,000 represents approximately 24 to 74 percent of the estimated true total cost of a break-in for a small retail business. The remaining cost is absorbed silently through deductibles, premium increases, lost revenue, and capital investment in the months following the incident.
Part IV — Who Gets Hit: Industry-by-Industry Breakdown
Commercial break-in risk is not distributed evenly across business types. Specific industries face disproportionate exposure based on the nature of their inventory, their hours of operation, their cash handling practices, and the accessibility of their premises.
Restaurants and Food Service
Restaurants are the most burglarized business type in the United States, with 23,358 incidents reported in the most recent full-year data — nearly double the figure for convenience stores and nearly twice that of construction sites.
Restaurants are targeted for several converging reasons. Cash handling is frequent and the end-of-day cash count is predictable. Alcohol inventory has high resale value. Kitchen equipment commercial ovens, mixers, refrigeration units can be removed and resold. And late-night hours create long windows of unattended vulnerability between close and open.
For restaurant owners, a break-in that targets the point-of-sale system or safety is catastrophic in its immediacy. But a break-in that targets commercial kitchen equipment can produce weeks of operational shutdown a cost that no average claim figure adequately captures.
Retail and Convenience Stores
Convenience stores recorded 12,397 burglaries, and discount stores 12,283, in the most recent reported data. The retail category is also where the organized retail crime dimension is most consequential. The NRF’s 2025 Impact of Retail Theft & Violence report found that organized retail crime groups are expanding beyond physical store theft into digital fraud, phone scams, and cargo theft, with over 70% of surveyed retailers reporting increases in phone scams conducted by organized groups and 67% reporting involvement from transnational crime organizations.
Construction and Trade Businesses
Construction sites recorded 12,979 burglaries, the second-highest category in the data. For trade businesses and contractors, theft from job sites and storage facilities represents a distinct risk profile from retail burglary. Power tools, copper wire, and heavy equipment are consistently among the most targeted items, both for their portability and their established resale channels.
The average value per cargo theft incident in 2025 was $273,990, a 36% increase from 2024. While cargo theft is a specialized category, it reflects the broader trajectory of organized theft from commercial operations: more coordinated, more professional, and significantly more expensive per incident.
Places of Worship and Community Organizations
Places of worship recorded 6,567 burglaries, the most frequently burglarized non-commercial category in the data. Religious organizations are disproportionately targeted because they typically have limited security infrastructure, predictable periods of vacancy, and known cash collections tied to services. For small and mid-sized congregations, a single break-in can represent a significant fraction of their annual operating budget.
Part V — The North American Divergence: U.S. vs. Canada
The break-in risk picture in the United States and Canada has followed divergent trajectories in recent years, and understanding that divergence is important for business owners and policymakers on both sides of the border.
United States: Declining Frequency, Persistent Cost
The FBI recorded 779,542 burglary incidents in 2024, a decline of approximately 8.1% from 841,942 in 2023. This continues a long-term downward trend that has been driven by a combination of factors: widespread adoption of security cameras and alarm systems, improved lighting in commercial districts, changes in police patrol patterns, and the deterrent effect of visible security infrastructure.
The national burglary rate fell to 229.2 per 100,000 people in 2024, the lowest rate in the FBI’s records going back to at least 1961. Today’s rate is about one-third of what it was in 2005. That long-term decline is genuinely significant progress. But it does not mean the individual business owner’s risk is negligible. A burglary occurs every 51 seconds in the United States. And critically, the geographic distribution of that risk is highly uneven.
New Mexico posted the highest state burglary rate at 536.5 per 100,000. New Hampshire was lowest at 48.7 per 100,000 a ratio of more than 10 to 1. For a small business owner making a location decision, that variance matters more than any national average.
Canada: Rising Pressure on Main Street
The Canadian picture is meaningfully different and more alarming for small business owners.
The share of Canadian small businesses directly affected by crime and safety issues nearly doubled in a single year, rising from 24% in 2023 to 45% in 2024, according to the Canadian Federation of Independent Business Canada’s largest association of small and medium-sized businesses, with 103,000 members across every industry and region.
In October 2025, half of Canada’s small business owners reported that crime had increased in their community over the prior 12 months, while only 2% reported a decrease.
Police-reported shoplifting of $5,000 or under rose 14% in 2024 compared to 2023, marking the fourth consecutive annual increase and a 66% surge since 2014.
Statistics Canada data shows there were 121,033 incidents of breaking and entering in 2024, which accounted for 13% of the overall Crime Severity Index the most of any single violation category. Although the breaking and entering rate declined 11% from 2023, the CFIB survey data suggests that business owners’ on-the-ground experience of crime is worsening even as some official statistics improve. This divergence likely reflects both the underreporting of incidents below the threshold for police response and the expansion of crime beyond traditional break-in categories into vandalism, organized theft, and community disorder that affects business operations without triggering a burglary report.
According to 2025 CFIB data, nearly half of Canadian small business owners 49% report being worried about the safety of themselves, their employees, and their customers.
| Metric | United States | Canada |
| Break-ins / burglaries (2024) | 779,542 | 121,033 (breaking & entering) |
| Year-over-year change | −8.1% | −11% (but rising crime perception) |
| Small businesses directly impacted by crime (2024) | 20% (burglary/theft, 5-year average, The Hartford) | 45% (all crime types, CFIB 2024) |
| Shoplifting trend | Increasing | +14% in 2024; +66% since 2014 |
| Business owner safety concern | Not separately tracked at national level | 49% worried about personal and staff safety (CFIB 2025) |
| Average insurance claim — burglary/theft | $8,000 (The Hartford) | Not separately published at national level |
Sources: FBI Crime in the United States 2024; The Hartford Small Business Claims Analysis 2025; Statistics Canada, Police-Reported Crime Statistics, 2024 (released July 2025); CFIB, “How Crime and Disorder Are Reshaping Daily Life for Canada’s Small Businesses” (2025 survey); CFIB, “Nearly Half of Canadian Small Businesses Have Had a Direct Experience with Crime” (October 2024).
Part VI — What Business Owners Do Wrong After a Break-In
The actions a business owner takes in the 24 to 72 hours following a break-in have a significant impact on their insurance recovery and their ability to restore normal operations. The following are the most common mistakes, drawn from insurance industry guidance and commercial property claim data.
Cleaning up before documenting. The instinct to restore order immediately after a break-in is understandable. It is also one of the most expensive mistakes an owner can make. Thorough, timestamped photographic and video documentation of every point of damage, entry point, interior damage, ransacked areas, destroyed equipment is the evidence base for the insurance claim. Cleaning up before documentation reduces the recoverable claim amount.
Underreporting to police. Based on The Hartford’s claims history, only 64% of small business owners file police reports after a break-in. The most common reasons include a lack of anticipated law enforcement response and the belief that stolen items fell below felony reporting thresholds. A police report is almost universally required to file a commercial property insurance claim. Business owners who do not file a report lose the ability to make an insurance claim on the incident entirely.
Beginning permanent repairs immediately. Temporary repairs to broken windows and locks should begin promptly to prevent secondary entry and loss. But permanent repairs should not begin before coordinating with the insurance adjuster, as insurers can dispute coverage for permanent work completed before a claim is assessed.
Signing contracts with unsolicited restoration contractors. Following any high-profile commercial crime event, businesses receive visits from restoration contractors offering immediate assistance. Most stolen property is never recovered in sellable condition, and business owners should be cautious about contracting with door-to-door vendors appearing immediately after an incident. Verify all contractors through the relevant provincial or state licensing authority before authorizing work.
Failing to account for business interruption coverage. Many commercial property policies include business interruption coverage that compensates for lost revenue during the period required to restore operations. Business owners who assume their policy only covers physical property damage frequently leave business interruption claims on the table.
Part VII – The Prevention Calculus: What Actually Works
The most effective response to break-in risk is prevention, and the data on deterrence is clearer than most business owners realize.
Research consistently identifies visible physical security barriers as the primary deterrent for commercial burglary. The evidence base across criminology research including studies by the UK Home Office, the U.S. Department of Justice’s Office of Community Oriented Policing Services, and multiple peer-reviewed publications in security studies journals converges on a simple principle: burglars choose the path of least resistance, and any visible evidence of significant resistance redirects criminal attention to less-protected targets.
The hierarchy of deterrence effectiveness, from most to least impactful for commercial premises, is:
| Security Measure | Deterrence Level | Notes |
| Physical exterior barriers (roll shutters, security grilles) | Highest | Prevents entry entirely; visible deterrent redirects criminal attention before attempt |
| Monitored alarm systems with police response | High | Reduces time of undetected occupancy; effective when response times are adequate |
| CCTV with visible cameras and signage | High | Strong deterrent for opportunistic crime; less effective against organized/determined offenders |
| Adequate perimeter lighting | Moderate–High | Eliminates concealment; effective combined with other measures |
| Reinforced door and window hardware | Moderate | Increases forced-entry effort and time; most effective combined with alarm |
| Alarm only (no monitoring) | Low–Moderate | Creates noise but no response if unmonitored |
| Standard locks only | Low | Minimal resistance; frequently overcome in minutes |
Physical barriers occupy the top of the deterrence hierarchy for a specific reason: they prevent the entry event from occurring at all. An alarm system triggers a response after a burglar is already inside. A camera records the incident for evidence after it has occurred. A roll shutter or security grille prevents the entry from happening. For businesses with high-value inventory or significant cash handling the same businesses that appear at the top of the commercial burglary frequency tables prevention is a fundamentally different investment than detection and response.
Security guards or professional security services provide the highest level of protection and typically qualify for insurance discounts of 15 to 25%. Businesses that demonstrate good risk management practices including physical security infrastructure often qualify for reduced commercial property insurance premiums.
Part VIII — The Five-Year Cost of Not Investing in Security
The return on investment calculation for commercial security investment is rarely performed explicitly but it is straightforward to construct from the data in this report.
The scenario: A small retail business facing a 20% probability of a commercial break-in within any five-year period consistent with The Hartford’s finding that burglary and theft is the most common small business claim, affecting 20% of businesses over five years.
The break-in cost: Using the midpoint of this report’s total cost model, $22,000 per incident.
The expected cost without security investment: 20% probability × $22,000 = $4,400 in expected break-in cost per five-year period, before accounting for premium increases and the elevated re-victimization probability following an initial break-in.
The cost of physical security investment: A professionally installed roll shutter system for a retail storefront typically costs $2,500 to $8,000 for a standard commercial opening. Annual maintenance and operation cost is minimal. The insurance premium reduction attributable to documented physical security hardening typically ranges from $150 to $375 per year, or $750 to $1,875 over a five-year period.
The net calculation: For a small business at average break-in risk, a $4,000 roll shutter installation pays for itself through a combination of insurance savings and avoided break-in costs within two to three years before accounting for the avoided revenue disruption, avoided premium increase following a claim, and the avoided cost of post-break-in security upgrades that would have been required regardless.
This is not a guarantee. Risk varies significantly by location, business type, and the local crime environment. But for business owners in categories that appear at the top of the commercial burglary frequency tables restaurants, retail stores, construction businesses the investment calculus is more favorable than most realize.
Methodology
Geographic scope. This report covers commercial break-in and burglary data for the United States and Canada. Where data is available at the city, state, or provincial level, that granularity is noted. Where only national data is available, it is presented as such and not extrapolated to specific markets.
Sources. U.S. burglary frequency and rate data is drawn from the FBI’s Crime in the United States 2024 report (released August 2025). U.S. small business insurance claim data is drawn from The Hartford’s five-year analysis of more than one million small business property and liability policies (2020–2025), released 2025. Canadian crime frequency data is drawn from Statistics Canada’s Police-Reported Crime Statistics, 2024, released July 2025. Canadian small business crime experience data is drawn from CFIB’s October 2025 survey of 2,542 Canadian small businesses and the October 2024 CFIB report on small business crime impact. Industry-type burglary frequency data is drawn from Guardian Protection’s analysis of Statista commercial burglary data (April 2026).
The break-in cost model. The total cost model in Part III is an original calculation constructed for this report. It synthesizes reported insurance claim data from The Hartford, published ranges for physical damage repair, estimates for business interruption based on revenue-per-day calculations, published ranges for insurance premium increases, and published ranges for post-break-in security investment. It is clearly labeled as an estimate and is designed to illustrate the cost stack, not to represent a universally applicable figure. Individual business outcomes will vary significantly based on policy terms, business type, and local market conditions.
Data limitations. Commercial burglary data in both countries reflects reported incidents only. Both the FBI and Statistics Canada acknowledge significant underreporting in commercial crime categories. The true frequency of commercial break-ins is higher than official figures indicate. Insurance claim data represents filed claims only and excludes incidents that fell below deductibles or were not reported to insurers.
Frequently Asked Questions
What is the most common type of insurance claim for small businesses?
Burglary and theft is the most common insurance claim for small businesses, impacting 20% of owners over a five-year period across The Hartford’s analysis of more than one million policies.
What is the average cost of a commercial break-in?
The average insurance claim for a small business burglary or theft is $8,000. However, this report estimates the true total cost including deductible, lost revenue, premium increases, and post-incident security investment at $10,750 to $33,250 for a representative small retail business.
Does filing an insurance claim after a break-in affect my premiums?
Yes. Filing a theft claim can lead to increased insurance premiums or, in some cases, the risk of policy nonrenewal. Business owners should weigh the claim amount against their deductible and expected long-term premium impact before filing.
Which types of businesses are most frequently burglarized?
Restaurants (23,358 incidents), construction sites (12,979), convenience stores (12,397), and discount stores (12,283) are among the most frequently burglarized business types in the United States.
Is commercial break-in crime getting worse or better?
The picture diverges by country and metric. U.S. burglary declined approximately 8.1% in 2024 and is at its lowest rate since at least 1961. In Canada, half of small business owners reported crime increased in their community in 2025, and only 2% reported a decrease, while 49% expressed concern about their personal safety and the safety of their employees.
Conclusion: The Cost of Waiting
Every month a small business operates without adequate physical security is a month it carries an unpriced risk. The statistics in this report do not exist to frighten business owners. They exist to help business owners make a fully informed calculation, one that weighs the true total cost of a break-in, not just the visible theft loss, against the cost of the security infrastructure that reduces the probability of that break-in occurring.
Four out of ten small businesses are likely to experience a property or general liability claim in the next ten years. The most common of those claims is burglary and theft. The question for every small business owner is not whether the risk is real. It is whether the investment required to reduce that risk is less than the expected cost of bearing it.
For the business types that appear at the top of every commercial burglary frequency table — restaurants, retailers, contractors the investment calculation in physical security infrastructure almost always resolves in favor of acting before an incident rather than after one.
The cost of a break-in, fully accounted for, is almost always higher than business owners expect. The cost of prevention, honestly evaluated, is almost always lower.